

Data Analysis
The more context and details you add, the better your response because the model understands precisely what you expect. Do not miss our Prompt Engineering Guide to learn how to write great prompts: https://docs.langdock.com/resources/prompt-elements
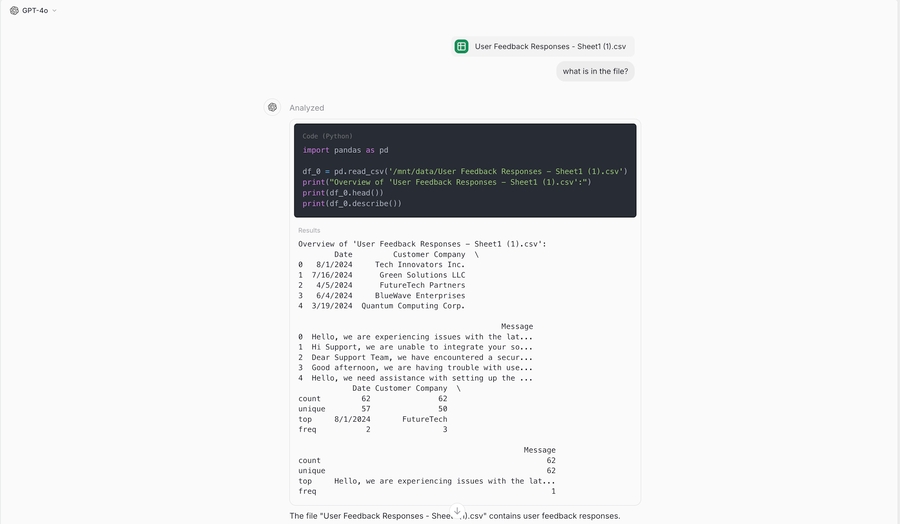
The data analysis tool in Langdock enables users to read and process CSV files, Excel or Google Sheets. You can use the data analysis tool to:
Read tabular data (CSVs, Excel sheets, and Google Sheets)
Perform mathematical operations, e.g., finding correlations, defining distributions or deviations, etc.
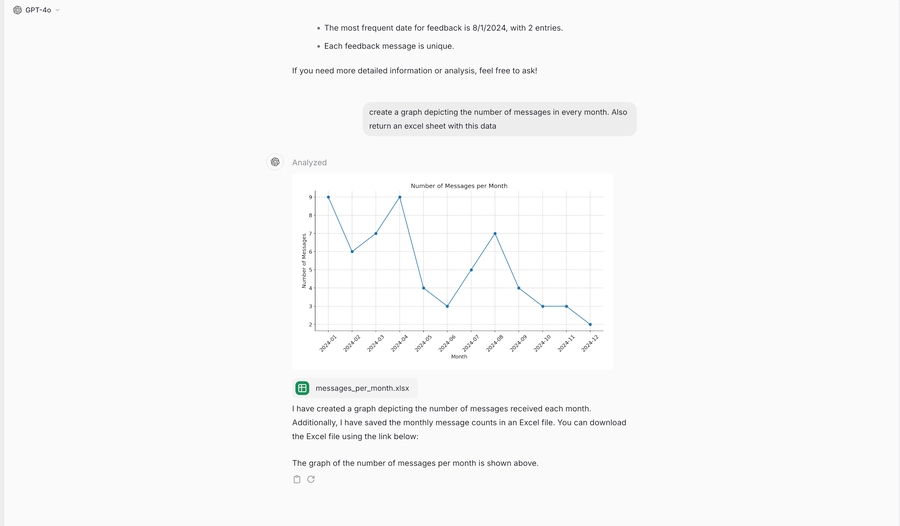
Create graphs and charts depicting data
Generate new files (Excel, CSV, PowerPoint, Word, etc.)
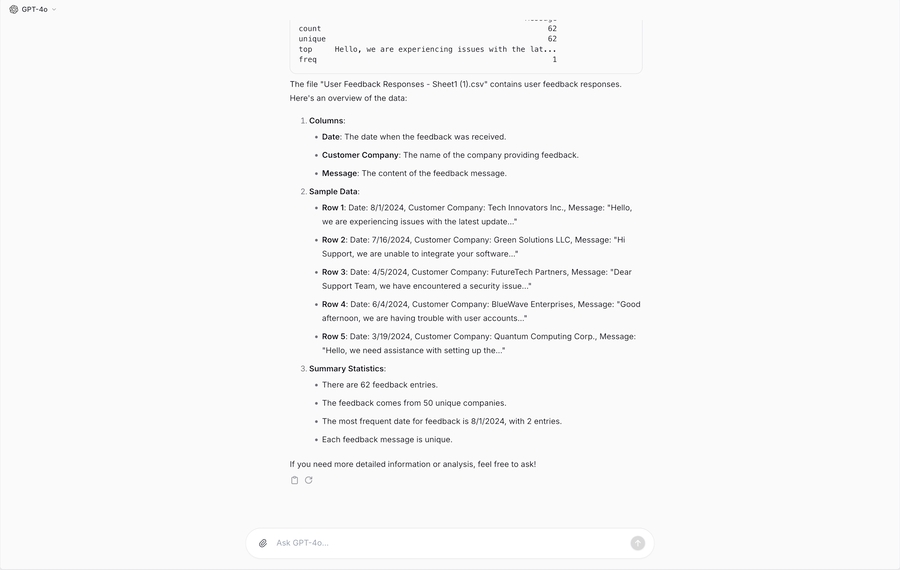
Describe what you’re trying to accomplish in the chat. Try to be as specific as possible.
How it works
Triggering the data analyst
The data analyst is a tool the model can choose. It gets triggered when you prompt the model to use it (“use the data analyst”) or when the according file is uploaded (GSheets, CSVs, Excel files).
Example data sheet: 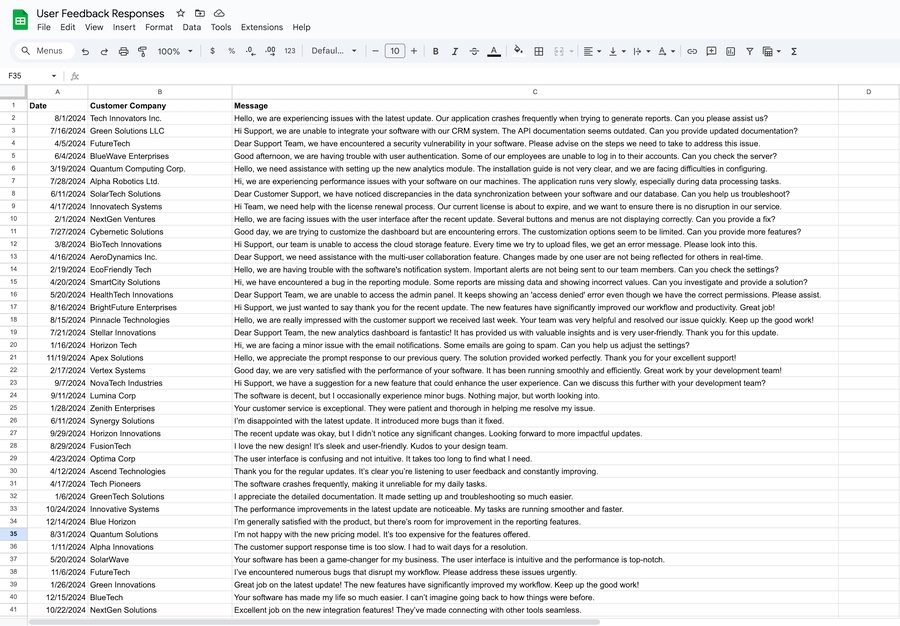
To receive the best results, please use GPT-4o and ensure that the column titles are in the first row.
Differences to other documents
The normal document search and the data analyst are different functionalities for different tasks with advantages and disadvantages. The document search is good at understanding a whole document content. It is not good at processing tabular data.
The data analyst cannot understand the entire file, but only the part that is extracted with Python. Everything else in the file has not been considered for the response. This makes it powerful for working with large datasets and tabular data, and for performing mathematical operations.
Best practices and troubleshooting
In order to parse the file correctly, all column titles should have a descriptive name. When referring to the column name, ideally use the full column title and not “Column K”. This is relevant as the AI model creates Python code which can only reference the correct column if the name is the same. Giving the same column name reduces the risk of the model generating code that references an incorrect column.
Make sure to enable the data analysis functionality in your settings and (if you are using a sheet in an assistant) also in the capabilities section at the bottom of the assistant editor.
Try to describe what you expect as precisely as possible. You can use the prompt elements from our prompt engineering guide (especially task, context, response format).
If possible, avoid empty cells in a sheet.
When you expect complex operations and receive no result or incorrect results, try to break the instruction into different prompts.
Was this page helpful?
Yes No
Related:
Image Generation: https://docs.langdock.com/product/chat/image-generation
Document Search: https://docs.langdock.com/product/chat/document-search
Responses are generated using AI and may contain mistakes.